Statistics page
On the Statistics page, you can view a trading summary of your master or investment account.
Main menuThis page is displayed to investors so that they can view the master account’s trading information before making a decision about subscribing to the account.
The page contains the following widgets:
Overview
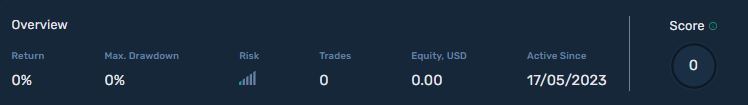
The following information is displayed in the widget:
Return
The profit or loss gained on the account since the account was created, expressed as a percentage. The return shows the change in account equity regardless of deposited and withdrawn funds.
Max. Drawdown
The maximum drawdown observed on the account.
Risk
The risk level calculated for the account.
Trades
The total number of open and closed positions on the account.
Equity, USD
The amount of funds on the account, in USD, including floating PnL calculated for open positions and funds credited to the account by a broker.
Active Since
The date when the account was created.
Score
The number of scores awarded to the account. Scores are awarded according to various trading parameters calculated for the account, such as Return, Max Drawdown, Profit Factor, and others.
Charts
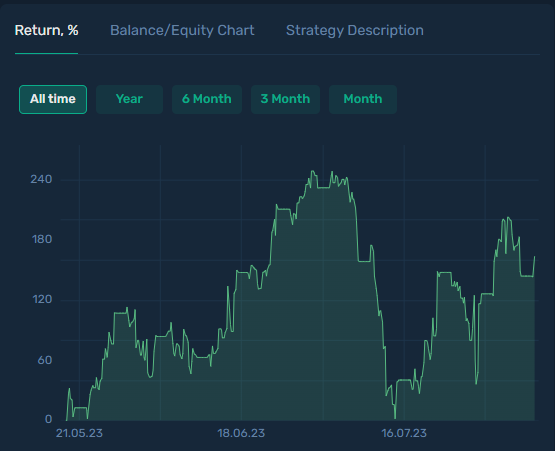
The widget includes line charts displaying the account return, balance, and equity calculated for the following periods: All time, Year, 6 Months, 3 Months, and Month.
On the Strategy Description tab, which is applicable for master accounts only, a description of the trading strategy used on the account is displayed. Master account owners can enter a description of their trading style or strategy on the Settings page.
Followers
Applicable for master accounts only

The widget shows the number of subscribed investment accounts as well as the number of subscribed or unsubscribed accounts over the last 7 days.
In addition, the total amount of assets under management (AUM) is displayed in the widget.
Fees
Applicable for master accounts only
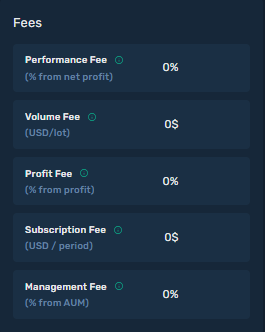
The master account’s fee plan. The plan should be accepted by investors when they subscribe to the master account.
Monthly Return
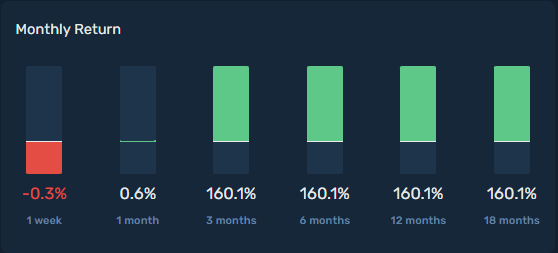
The widget includes a bar chart that shows the account return calculated for certain periods.
Trading Statistics
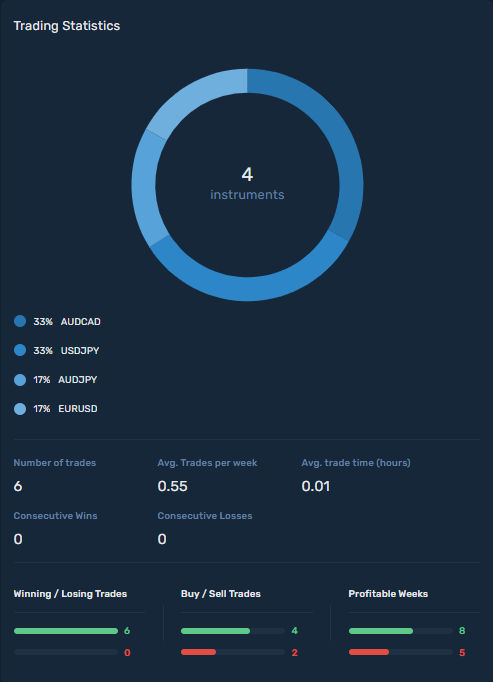
The widget includes a pie chart that shows the number of traded instruments and the percentage ratios of their use.
The following information is displayed in the widget:
Number of trades
The total number of open and closed positions on the account.
Avg. Tardes per week
The average number of positions on the account per week. Both open and closed positions are taken for calculations.
Avg. trade time
The average time, in hours, between opening and closing a position, which is calculated against closed positions.
Consecutive Wins
The number of profitable positions in a row. Both open and closed positions are taken into account.
Consecutive Losses
The number of losing positions in a row. Both open and closed positions are taken into account.
Winning / Losing Trades
The upper green value is the number of profitable positions. Both open and closed positions are taken for calculations.
The lower red value is the number of losing positions Both open and closed positions are taken for calculations.
The profit or loss gained from closed positions is defined based on the positions realized PnL, including trade commissions.
The profit or loss gained from open poisons is defined based on the PnL calculated at the moment of position opening, including a trade commission of the opening deal.
Buy / Sell Trades
The upper green value is the number of open and closed positions to buy assets.
The lower red value is the number of open and closed positions to sell assets.
Profitable Weeks
The upper green value is the number of profit-making weeks.
The lower red value is the number of loss-making weeks.
Calendar weeks, from Monday to Sunday, are taken for calculations.
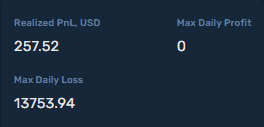
Realized PnL, USD
The realized PnL, in USD, calculated against closed positions, including trade commissions.
Max Daily Profit
The maximum daily profit earned on the account.
Max Daily Loss
The maximum daily loss gained on the account.
Profit Factor
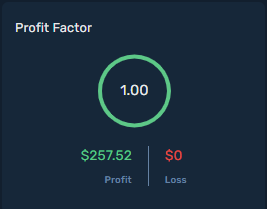
The profit factor is defined as the total profit earned on the account divided by the total loss.
The total profit is the sum of profits gained from closed profitable positions.
The total loss is the sum of losses gained from closed losing positions.
Trading History
A list of closed positions on the account. For details, refer to the Closed positions tab of the Trading Report page.
Open positions
A list of open positions on the account. For details, refer to the Open positions tab of the Trading Report page.